Tracking the rise and fall of Scottish SARS-CoV-2 / COVID-19 using virus sequences
CSO Project: COV/EDI/20/11
Project summary
The SARS-CoV-2 viruses from COVID-19 cases are being sequenced, and since virus sequence data accumulates mutations over time, even over the time scale of a few weeks there are sufficient differences between sequences to infer clustering and transmission patterns. This project will use the virus sequence data together with epidemiological models of the population to infer which regions infected which others, how the epidemic is progressing, and through inference and simulations advice on when/how a low enough level of community transmission has been reached.
Aims
- Analyse virus sequence data from Scotland in context of UK and globally.
- Simulate trees and sequences from regional model to compare to real data.
- Calculate metrics from sequence data (imports / exports, lineages, viral diversity) to show if the epidemic is reducing, and / or being re-seeded from other regions
- To help assess restrictions - relaxed or re-tightened ?
Data sources
- UK Sequence data collected as part of COVID-19 Genomics UK Consortium https://www.cogconsortium.uk
- Global sequence data from GISAID https://www.gisaid.org
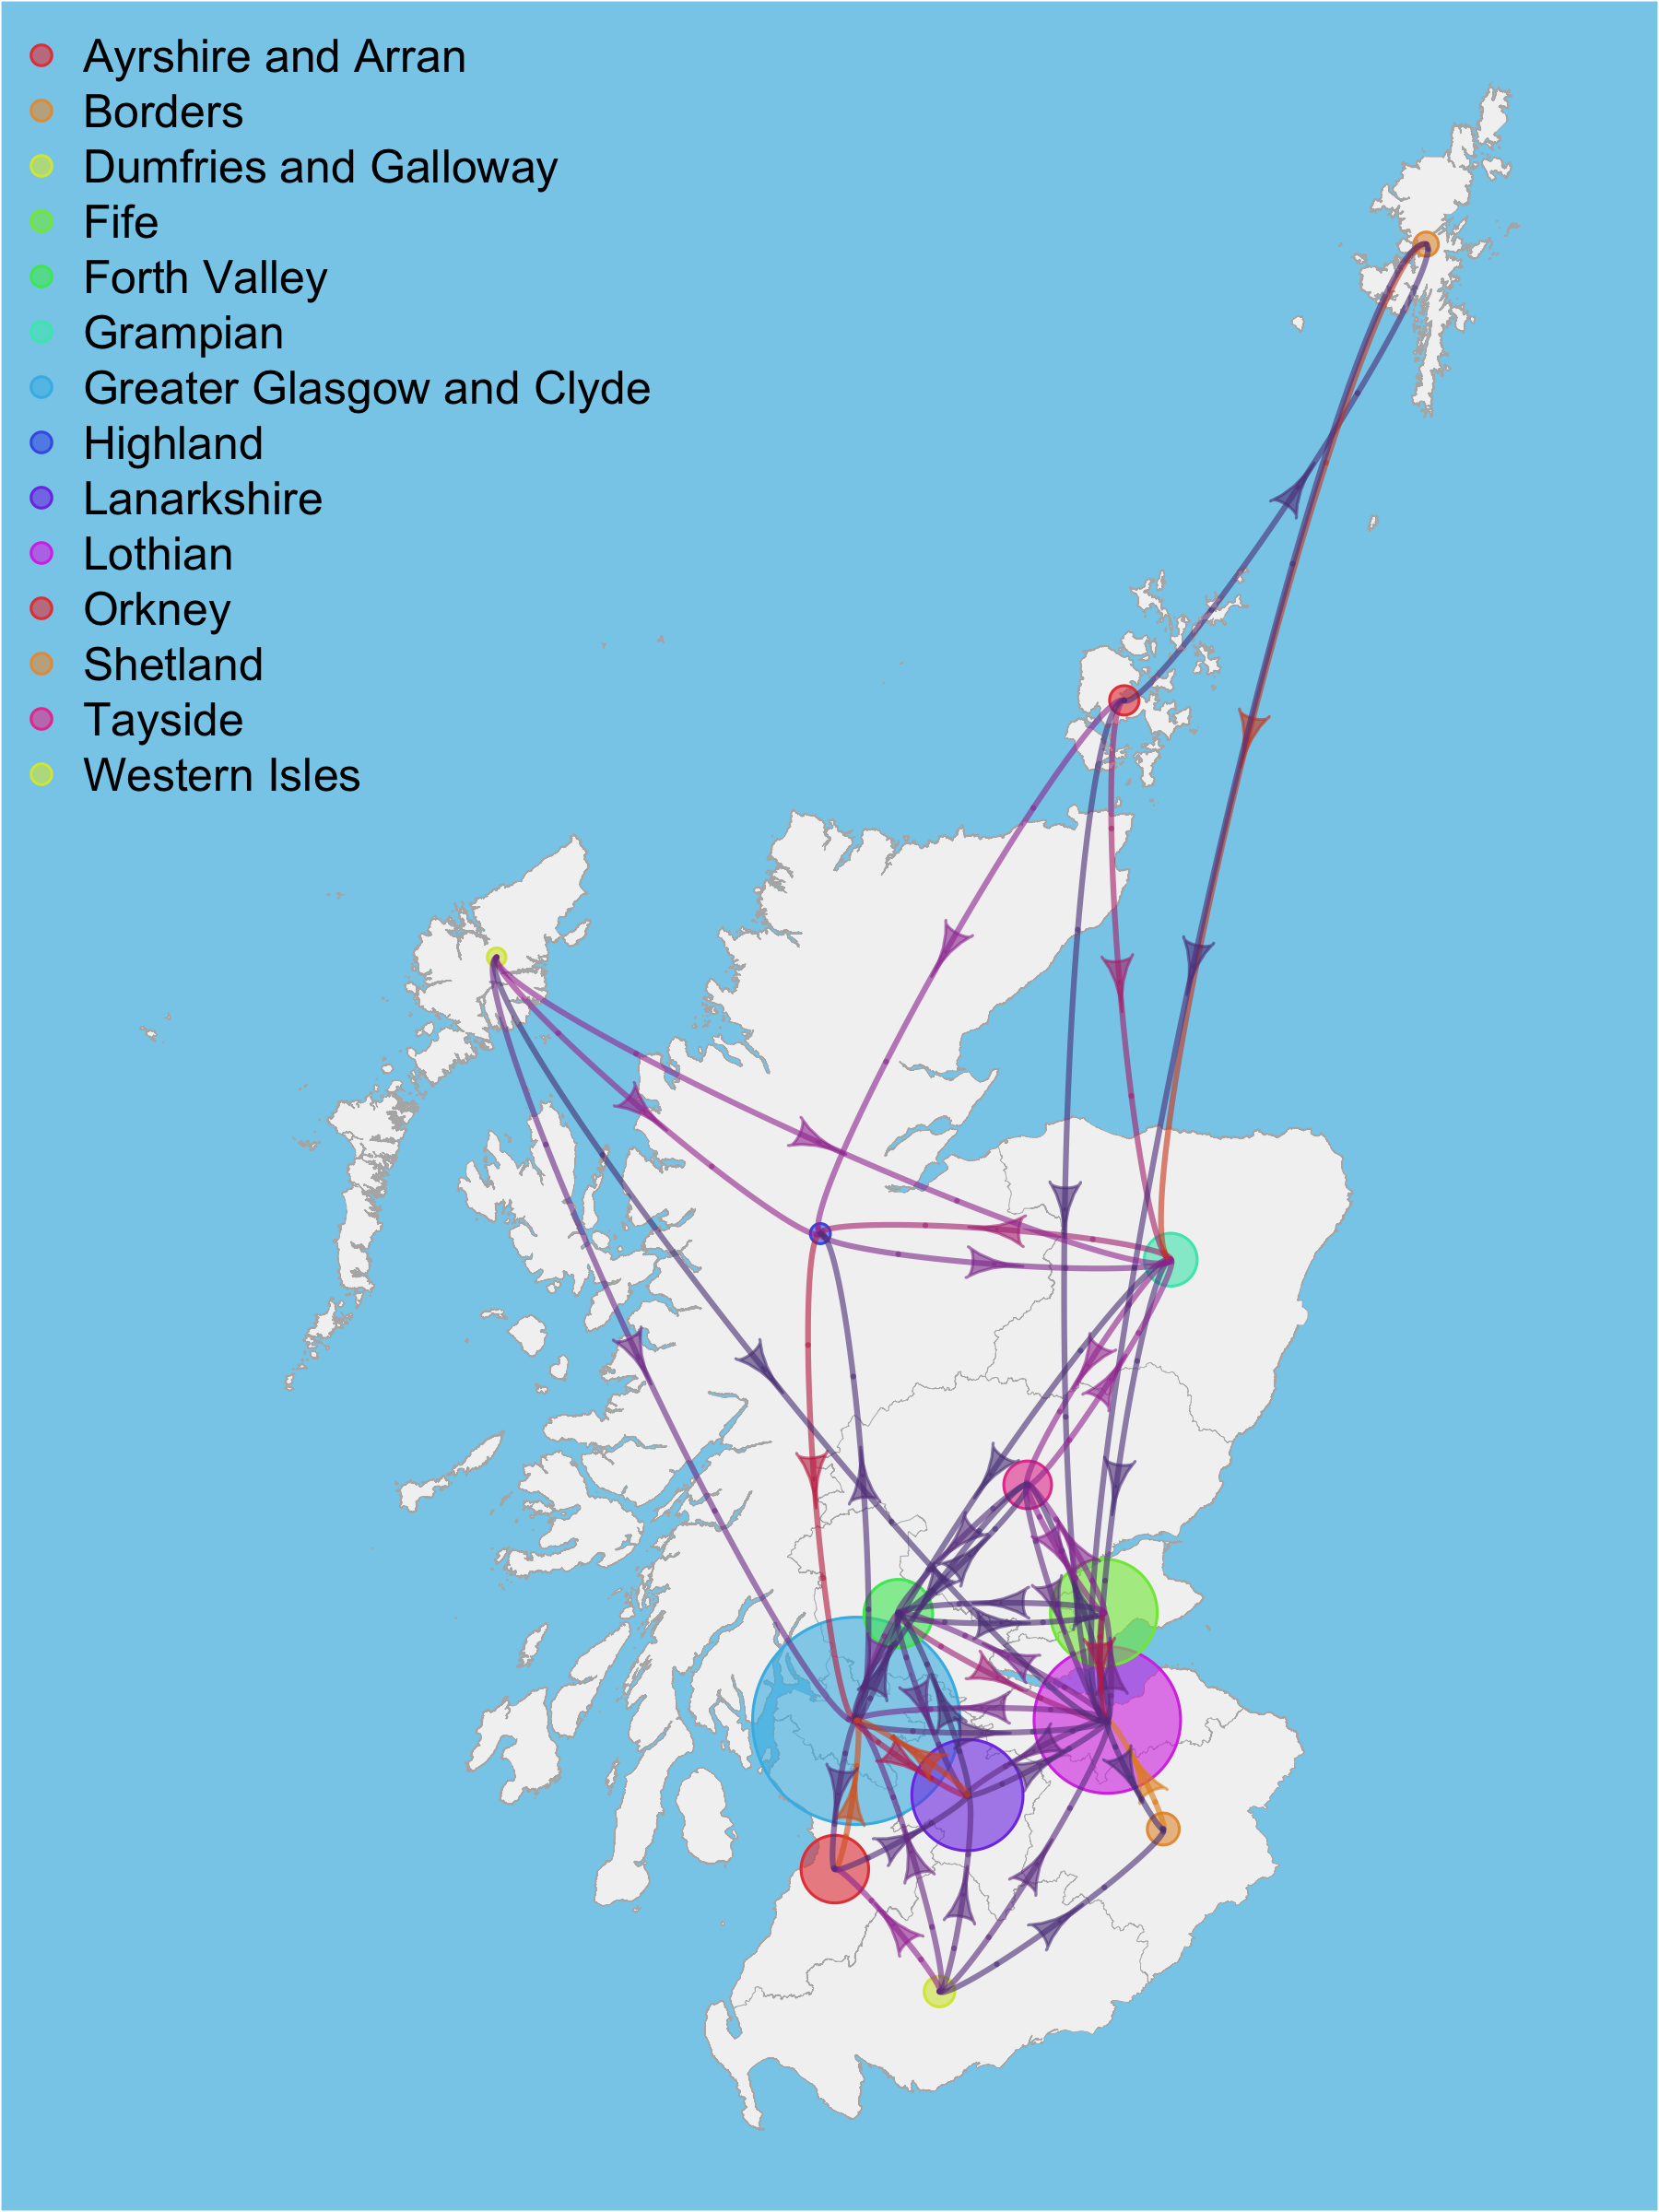 Map showing movements between regions and population density (2018 data)
Summary of the data set made available on the MRC CLIMB server via the COVID-19 Genomics UK Consortium (COG) https://www.cogconsortium.uk
The data set comprises whole genome sequences from England, Scotland, Wales and Northern Ireland sequenced by several centres in the consortium; and GISAID sequences from other countries included as background information. The UK sequences are also submitted to the GISAID database https://www.gisaid.org as part of the sequencing pipeline
Scottish sequences are split to Scottish Health Board, apart from Western Isles, Orkney, and Shetland, where they are classed along with the other unknown locations (-) due to low case and sequence numbers.
Global and UK Lineages
The COG consortium has generated a global phylogenetic tree of all the sequences, and to assist analysis of this large number of sequences, they are classified into lineages containing common mutations via the Pangolin software, see https://pangolin.cog-uk.io and https://doi.org/10.1101/2020.04.17.046086
It is important to note that there is little difference between the properties of these lineages in terms of transmissibility and virulence at the present time.
The global tree and lineage details are available from the Microreact website which is maintained by The Centre for Genomic Pathogen Surveillance to enable weekly evaluation of the lineages circulating in the UK.
Microreact project at https://microreact.org/project/cogconsortium/
Global Imports and Exports
Using a discrete traits model on the non-timescaled COG global tree, it is possible to estimate the numbers of imports and exports to a region. Here the simplest equal rates discrete trait model is used (most similar to parsimony). Estimates are dependent upon the number of sequences in each category, and the accuracy of the tree.
The values are the weighted counts of transitions on the tree to or from places, and the total transitions between places (excluding the within-place transitions).
Lineages imported to Scotland
Timescaled trees were made from extended UK lineages with sequences in Scotland, and a discrete traits model was used to infer which region infected which.
Here the simplest equal rates discrete trait model is used (most similar to parsimony). Estimates are dependent upon the number of sequences in each category, and the accuracy of the sub trees.
Results are for the ancestral origin of lineages that exist in Scotland. Some UK lineages just start in Scotland anyway, but many start in England. Here the ancestral origin of the UK lineages in Scotland are summarised, not the individual cross border events (see next tab for that).
Timing the Imports and Exports to Scottish Health Boards
Timescaled trees were made from extended UK lineages with sequences in Scotland, and a discrete traits model was used on the UK tips of these sub-trees to infer which region infected which.
Here the simplest equal rates discrete trait model is used (most similar to parsimony). Estimates are dependent upon the number of sequences in each category, and the accuracy of the tree.
Results for Orkney, Shetland and the Western Isles are not included since they have too few sequences.
Growth rates and properties of Lineages in Scotland
The timescaled lineages trees were analysed and the effective population size over time and growth rates were calculated using R package skygrowth
Phylodynamics between Health Boards in Scotland - Data from 2020-08-18
Viral imports and exports between different Health Boards in Scotland, and also imports and exports to England, Wales and Northern Ireland, were inferred from the UK lineage data (see Health Board Imports/Exports tab).
The width of the arrows on the map respresent the number of imports/exports in a week. White arrows are between Health Board transmissions, whereas those from England, Wales and Northern Ireland are pale red, green and purple. Transmissions from Scotland to the other nation states of the UK are pale blue.
The maximum number of sampled sequences in the week are represented by the size of the white circles. Note that the transmissions are inferred between ancestral nodes on the tree, so may pre-date the sampled sequences.
The background colour of the Health Boards is a function of the maximum number of new cases detected per week, data obtained from table 1 of https://www.gov.scot/publications/coronavirus-covid-19-trends-in-daily-data/
Results for Orkney, Shetland and the Western Isles are not included since they have too few sequences.
UK Lineages in Scotland through time - Data from 2020-08-18
Word cloud of numbers of Scottish sequences per week with UK lineages.
Size of label represents the numbers of Scottish sequences in that lineage in the 7 day period.
Labels are coloured by the spike protein mutations, N439K and D614G. The colour is determined by the majority of sequences in the lineage (not just in the week). This is the same scheme as in the previous tab.